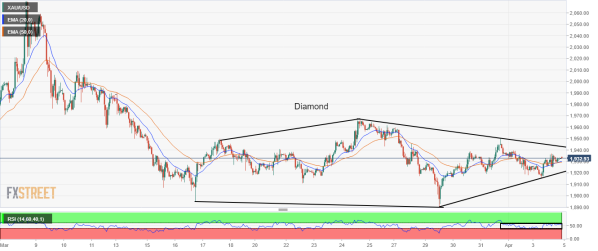
Gold hourly chart

Russia-Ukraine peace talks look de-escalated as Ukraine accused Russia for death of civilians.
The DXY is scaling higher on lower US Jobless rate.
Gold (XAU/USD) is oscillating in a range of $1,915.78-1,949.86 from the last three trading sessions amid positive market sentiment. The digestion of worst-case scenarios amid Russias invasion of Ukraine by the market participants has kept the tone of the market favorable. The precious metal is trading lackluster and is looking for a trigger to find direction.
A progress in the Russia-Ukraine peace talks was clearly witnessed by investors after the discussions over the major stipulations to be printed in a special document of ceasefire. Also, the month long military activity of Russian rebels in Ukraine was indicating that Russia might be out of military equipments, liquidity and resources soon, which will force it to approach a ceasefire. However, the allegation from Ukraine President Volodymyr Zelenskyy on Russia over the death of civilians by the Russian forces in Bucha, Ukraine has stretched the ceasefire expectations.
Meanwhile, the US dollar index (DXY) has reclaimed 99.00 on expectation of strong US Services PMI on Tuesday. A preliminary estimate for the US Services PMI is 58 against the prior print of 56.5. Also, the odds of a jumbo interest rate hike have increased sharply after the upbeat Unemployment Rate. The US Jobless rate at 3.6% and its consistency below 4% is bracing a 50 basis point (bps) interest rate hike by the Federal Reserve (Fed). Strong labor market amid achievement of full employment levels is hoping an aggressively tight monetary policy in May. Also, the US Treasury yields are balanced in a limited range. The 10-year benchmark US Treasury yields is trading close to 2.4% and is expecting to witness higher levels going forward.
This week, the minutes from the Federal Open Market Committee (FOMC) will remain the major event for the FX domain. The FOMC minutes will dictate the strategy behind advocating the 25 bps hike interest rate decision by the Fed.
Gold Technical Analysis
On an hourly scale, XAU/USD is oscillating in a diamond pattern that signals a bullish reversal after a steep fall. The formation indicates inventory adjustment in which the inventory is shifted from retail participants to institutional investors. The 20- and 50-period Exponential Moving Averages (EMAs) near $1,930 are overlapping to each other, which signal a consolidation ahead. Meanwhile, the Relative Strength Index (RSI) (14) is oscillating in a 40.00-60.00 range, which indicates a lackluster performance.

Leave a Reply