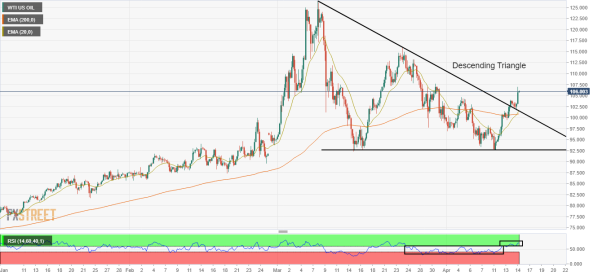
A firmer breakout of the descending triangle pattern has underpinned the bulls.
The RSI (14) has shifted into a bullish range that adds to the upside filters.
A minor pullback towards $104.02 will present an optimal buying opportunity for the asset.
On a four-hour scale, a breakout of a descending triangle has put the bulls in the driving seat. Usually, a descending triangle breakout is followed by wider ticks and high volumes. The horizontal support of the chart pattern is plotted from March lows at $92.37 while the descending trendline is placed from March high at $126.51, adjoining the March 24 high at $115.87.
A bull cross, represented by 20- and 200-period Exponential Moving Averages (EMAs), is advocating the control of bulls on the asset.
Meanwhile, the Relative Strength Index (RSI) (14) has shifted into a bullish range of 60.00-80.00 from 40.00-60.00, which are hinting at a fresh impulsive wave ahead.
A minor pullback towards Wednesdays high at $104.02 will be an optimal opportunity for the buyers, which will send the asset towards the March 28 high at $109.78, followed by March 24 high to near $116.00.
On the flip side, bears may dictate the prices if the asset drop below the 20-EMA at $100.80. This will drag the asset towards the round level support and horizontal support at $95.00 and $92.37 respectively.
WTI four-hour chart

Leave a Reply