
As mentioned in our previous article ‘FX Outlook: What Is Coming Up This Week?’, traders and investors should be all buckled up by now in preparation for the volatile movements from the upcoming major interest rate announcements.
Let us take a look at the technical charts of the main currency pairs to see where we are at before the news.
USD:
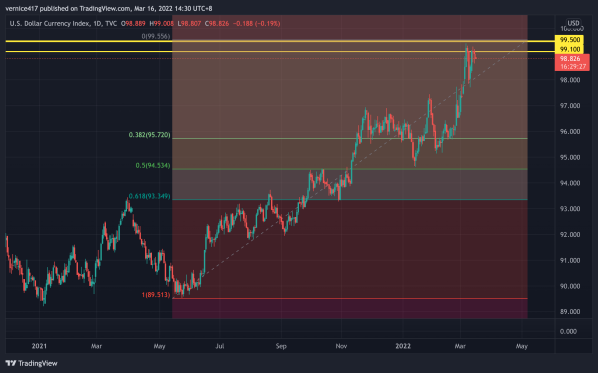
The US Dollar has been in a steady uptrend since mid-June 2021. Currently, it has approached a significant resistance zone (99.100 – 99.500) which was last seen in 2019. An important point to note is that the round price of $100 is considered as a psychological resistance for USD.
All eyes and ears on the Federations interest rate announcement tonight. Would the interest rate be above or below the forecasted 0.5%? That would be the determinant for the short-term direction of USD.
According to the Fibonacci tool, as long as the price sustains above the 0.618% level, which is approximately 93.350, the uptrend continuation is still intact. If it breaks below, a trend reversal would then be confirmed.
GBPUSD:
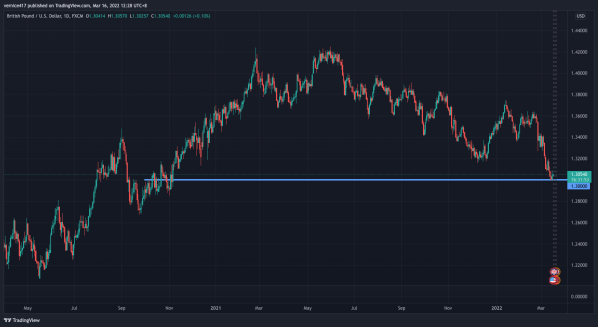
This is a pair that is literally sitting on the fence now because tonights Federal Funds Rate will impact USD and tomorrow Bank of England will also announce their interest rate decision which will affect GBP.
Moreover, should the peace talk between Russia and Ukraine arrive at an agreement, it could be likely for GBP to have a reversal, at least in the short term.
For the time being, the price is sitting on the support level of 1.300 as derived from both the daily and weekly charts. The two announcements this week would be the driving factor of the next momentum of GBPUSD.
GBPJPY:
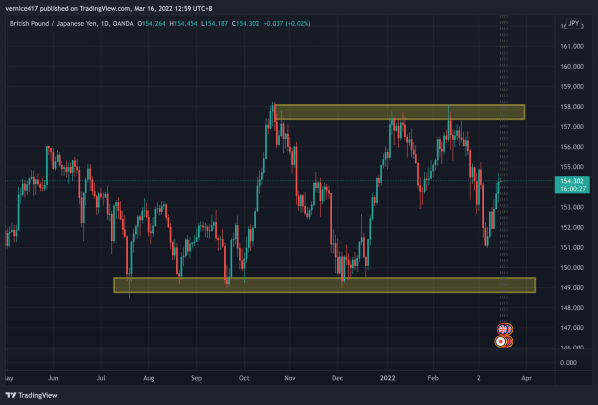
In the big picture, GBPJPY has been moving in a sideways motion since last July, trading in between 149.00 – 158.00.
Now, the nearest key level GBPJPY is facing is 155.00. If it rejects this level, we could anticipate a drop towards 151.00 or even 149.00. On the contrary, if it breaks above 155.00 and then retraces with a solid retest, it is highly possible for the price to go towards 156.00 and 158.00 before another reversal.
It is impossible to predict when exactly will price breakout of this sideway structure。 However it is always safe to not bet on a breakout move unless there is a legitimate retest after this break, in order to keep the risk-reward ratio in check.
EURUSD:
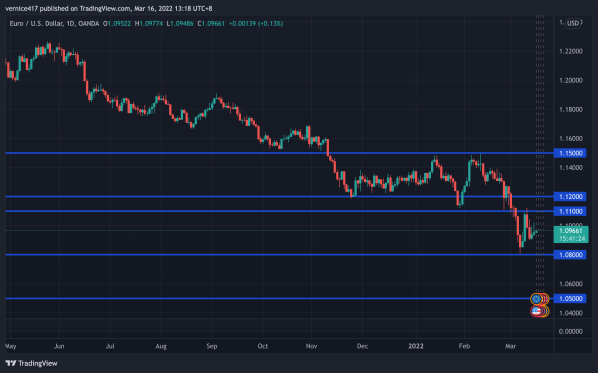
With the weakening of EUR and the bullish momentum of USD, it is evident that EURUSD has been in a continuous bearish trend since 2021. The initial support of 1.11 was broken when Russia invaded Ukraine causing Europe to enter into a state of chaos.
We saw EURUSD drop all the way to 1.08 and come back for a retest at 1.11 before going down again. At the moment, it is trading in the middle of nowhere between 1.11 and 1.08. Suppose 1.08 fails to hold whilst 1.11 is still unbreakable, EURUSD could be falling towards the 1.05 level.
AUDUSD:
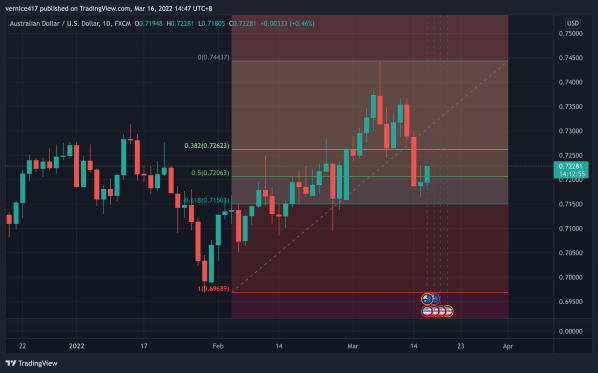
In the grand scheme of things, AUDUSD is still moving within a big downtrend channel on the daily chart. Nevertheless, since the outbreak of the Russia-Ukraine war, AUD being on the other safe side of the globe has become the temporary safe haven for traders and investors to protect their assets.
In the short term, the 0.618% Fibonacci level is serving as a support for the price. As long as it sustains above 0.71500, the price is likely to challenge 0.74500 again.
Gold:
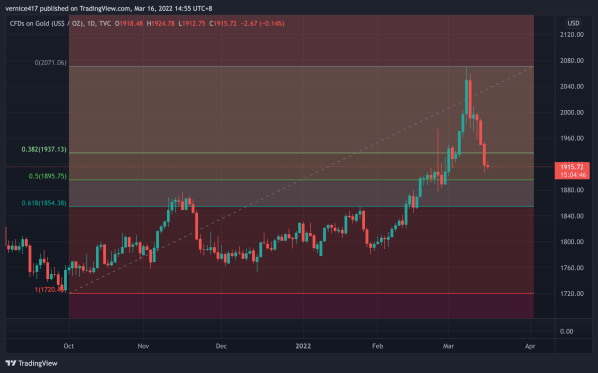
Gold has been in a steady uptrend since rising inflation started to become a major concern. During the Russia-Ukraine war, gold skyrocketed all the way to the 2080 level before its dramatic retracement.
Many would argue that this is the end for gold, but solely looking at the technical chart, as long as price sits above 0.5% Fibonacci level, which is 1854, the uptrend is still unimpaired.

Leave a Reply