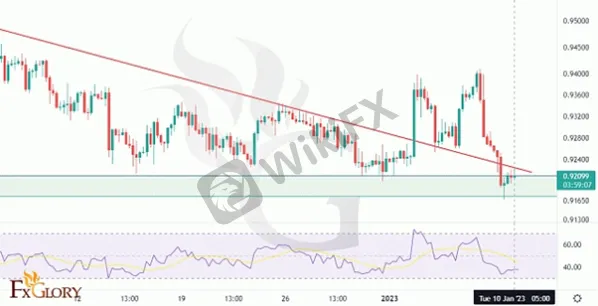
Today 10th of January, the USD/CHF pair is trading in the range of Chf0.9195-0.9230 – about the 10-month low of Chf0.9165 reached yesterday. On the hourly chart, the pair fell below the moving average line MA (200) H1 (Chf0.9275) and on the four-hour chart below MA (200) H4 (Chf0.9340). Technically speaking, the support of Chf0.9150-65 can keep prices from further decline. The upper bound of Chf0.9410 represents the resistance level. Although Various indicators are currently giving bullish signals, and the candlestick pattern also points to a possible bullish wave.
A red descending line on the chart indicates a broken trend line. As you can clearly see, the price line has already pulled back to this line and has since moved up slightly. The green box below the price line reflects a static support zone that has managed to push the price line up a few times and is expected to do so again on its next encounter with the price line.
• There is a resistance level at 0.93400 followed by resistance at 0.94000 and 0.94500.
• There is a support level at 0.91900. Below, there is 0.916800 and 0.91460.

Remember: this is not a financial advice, and these analyses are just to increase the traders awareness but not a certain instruction for trading not certainly accurate.

Leave a Reply