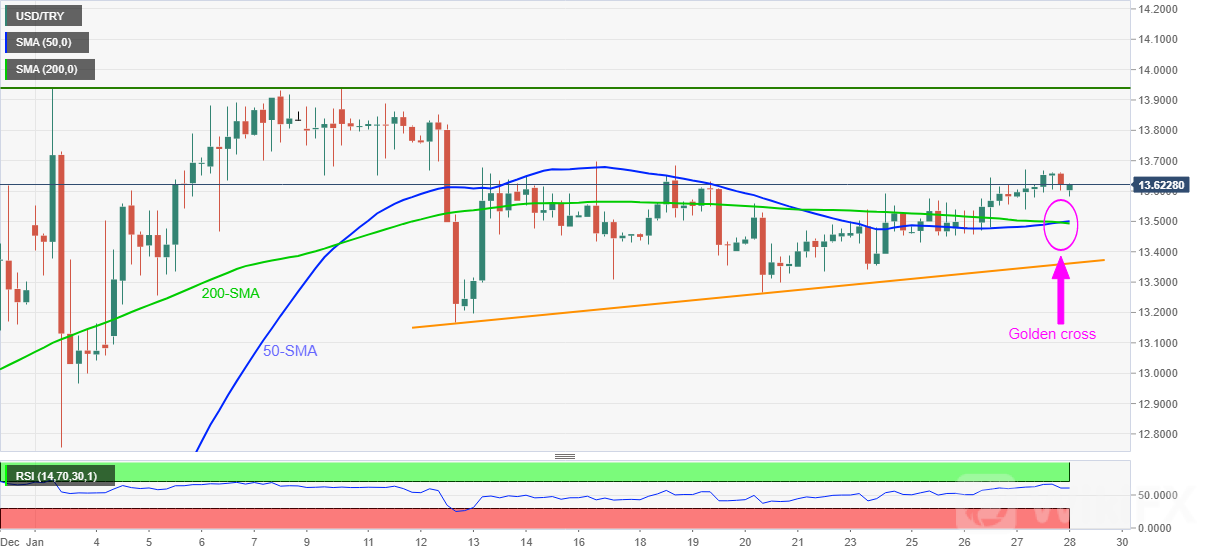
USD/TRY: Four-hour chart

-
USD/TRY snaps two-day uptrend during a sluggish session, retreats from daily high of late.
-
A bullish moving average crossover, firmer RSI favor buyers.
-
12-day-old support line adds to the downside filters, monthly horizontal line restricts immediate upside.
The Turkish lira (TRY) pair rose during the last two days before easing from $13.67. The pullback moves, however, remain elusive due to the golden cross on the four-hour (4H) play.
A golden cross is the bullish moving average crossover wherein the 50-SMA crosses the 200-SMA from the upside to signal the underlying assets further advances.
That said, the USD/TRY prices need to overcome the $13.70 immediate hurdle ahead of confronting the monthly resistance line near $13.95.
During the quotes upside past $13.95, the December 21 peak of $14.13 will act as the key hurdle to the USD/TRY rally.
On the contrary, the stated SMA convergence near $13.50 restricts the short-term downside of USD/TRY.
Following that, an upward sloping trend line from January 12, near $13.35, will be important before welcoming the USD/TRY bears.

Leave a Reply