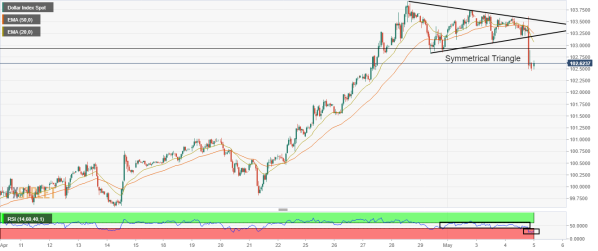
The 20-and 50-EMAs are scaling lower, which adds to the downside filters.
Momentum oscillator RSI (14) has shifted into a bearish range of 20.00-40.00.
The US dollar index (DXY) has witnessed a steep fall after failing to sustain above the round level support of 103.00. The DXY plunged sharply after the Federal Reserve (Fed) announced its monetary policy on Wednesday. The asset printed its 19-year high at 103.93 and faced a tad longer consolidation has resulted in a bearish reversal.
The formation of a Symmetrical Triangle chart pattern at near 19-year high levels has turned into an intense sell-off for the asset. The downside break of a symmetrical triangle after a stellar bull run indicates inventory distribution in which institutional investors shift their inventory to retail participants.
The 20- and 50-period Exponential Moving Averages (EMAs) at 103.15 and 103.22 respectively are sloping downwards, which signals more weakness ahead.
Meanwhile, the Relative Strength Index (RSI) (14) has shifted into a bearish range of 20.00-40.00, which indicates a fresh leg of weakness in the counter.
A pullback towards the 20-EMA at 103.15 will be an optimal selling opportunity for investors, which will drag the asset towards Wednesdays low at 102.46 followed by the round level support of 102.00.
On the flip side, bulls could regain control if the asset oversteps Wednesdays high at 103.61. Fulfillment of the same will force the asset to reclaim a 19-year high and the round level resistance at 103.94 and 104.00 respectively.

Leave a Reply