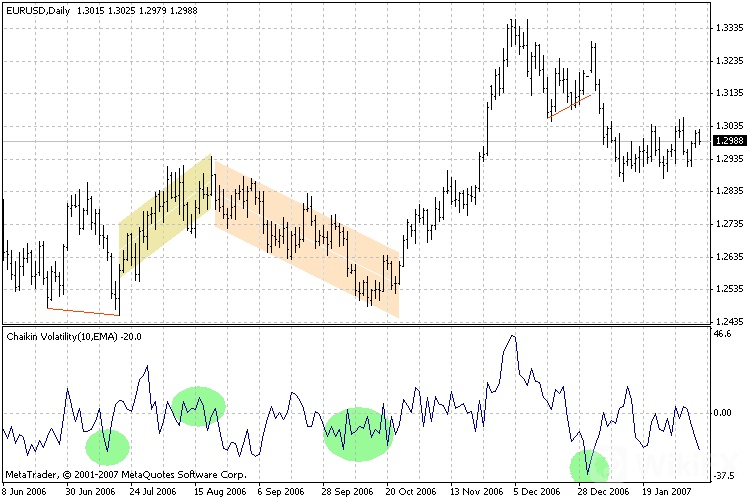
Market volatility is quite an important factor in analysing the behaviour of security prices. The trend changes more often and more rapidly during times of higher volatility. The changes in the prices are slower and less frequent in periods of lower volatility. These changes affect the readings of indicators as the signals may come too early or too late. This is why it is important to include the volatility factor in the calculations. And today I am going to present the Chaikin Volatility indicator.
Chaikin Volatility basics
The indicator invented by Marc Chaikin is a tool that measures volatility by analysing the gap between the low and high prices of the asset over a specific time. It is known as the Chaikin Volatility indicator (VT).
Adding the Chaikin Volatility to the Pocket Option chart
Log in to your Pocket Option account. Choose the financial instrument you are going to trade during this session. Set the chart period. Click on the Chart Analysis icon and then on the Volatility group of indicators. The Chaikin Volatility will be displayed.
Of course, you may also start typing the name of the indicator needed in the search window.
The VT will appear in the separate window beneath your price chart. It has a form of a line that oscillates around the 0 line.
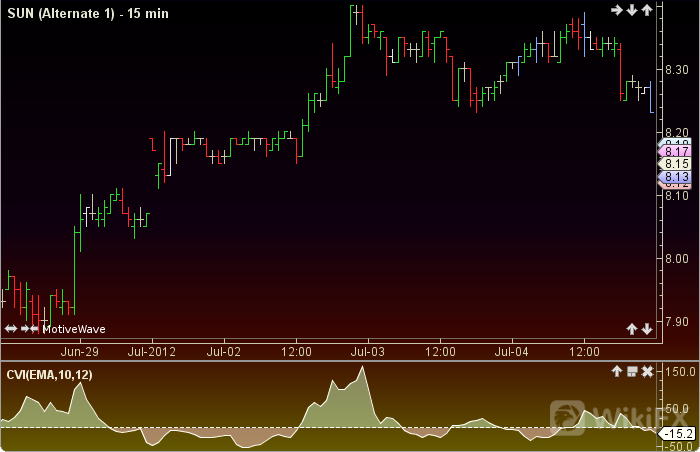
How the Chaikin Volatility works
The indicator calculates the exponential moving average of the difference in the prices high and low. Then, it measures the change of this moving average over time in a percentage value.
Chaikin advises using a 10-day moving average to review volatility.
When the indicator shows low values, it means that the intraday prices range from high to low is comparatively constant. When the indicator readings show high values, the intraday prices range from high to low is pretty wide.
The situation when the price creates tops on the price chart and the volatility is increased in a short time indicates the traders get nervous. When the market tops are accompanied by decreasing volatility over a long time, it indicates a growing bull market.
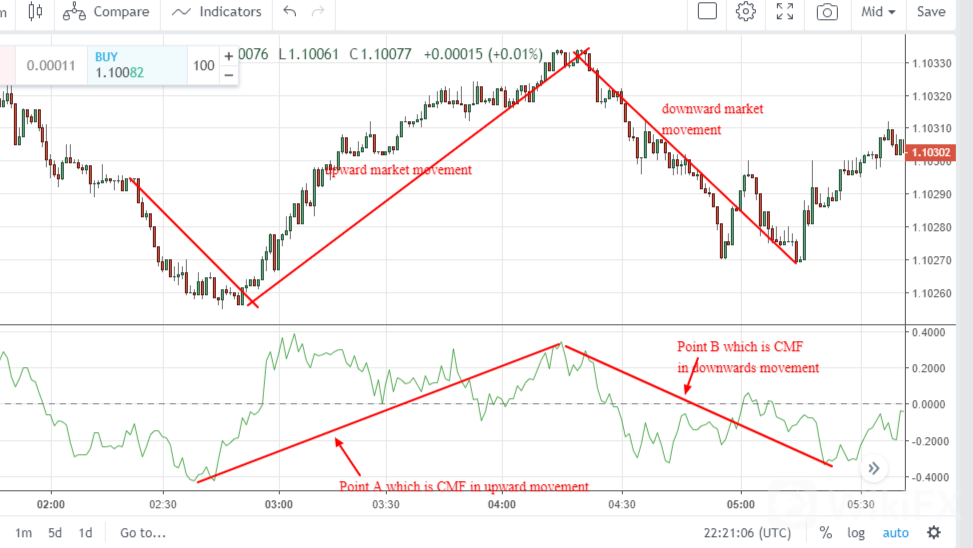
Now, when the price forms bottoms and the volatility decreases over a long time, it suggests the traders do not put much interest in the market.
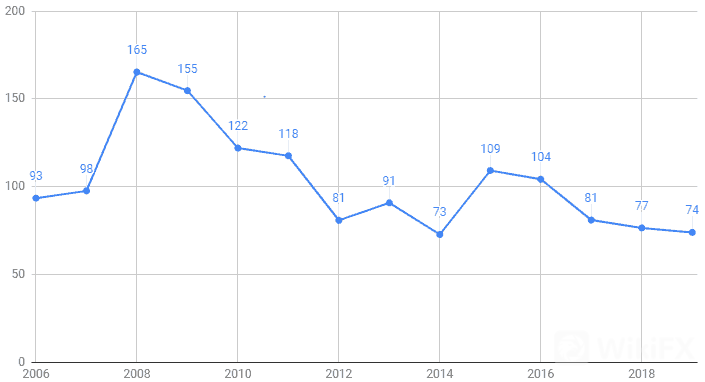
When volatility increases over a short period of time and there are bottoms in the market, it means traders sell in panic.
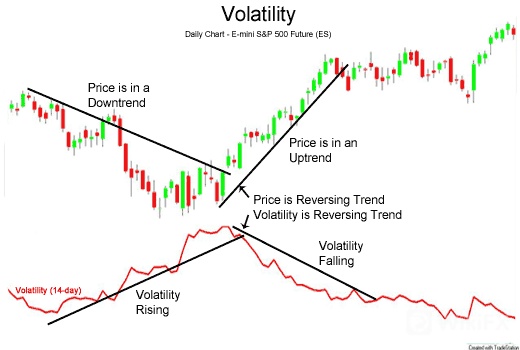
Low volatility and its decrease can be observed during the upward movement of the prices.
At the top of the uptrend, prior to a reversal of the trend, a slow increase in volatility can occur.
Higher volatility can be noted during the downward move.
Near the bottom of the downtrend, a short time volatility increase can be seen.
Final words
The Chaikin Volatility indicator measures volatility. The author recommends using a 10-day moving average in calculations.
Head to the Pocket Option demo account and check how the Chaikin Volatility works. This is a free practice account where you can check every new indicator or trading technique. It is supplied with virtual cash that you can power up any time you want. You do not lose your own money even in case of a failing transaction. Train your skills before moving to the real account.
Below, you will find the comments section. Share your thoughts about the Chaikin Volatility indicator with us. I would be glad to hear from you.

Leave a Reply