Nikkei 225 Index Leaps as LDP Election Win Opens Stimulus Plans. Where will Nikkei 225 land?
NIKKEI 225, JAPAN, USD/JPY, YEN – TALKING POINTS
Japans Nikkei 225 index found support on LDP election victory
A clear majority for the LDP opens the way for stimulus spending
External headwinds fade. Can the Nikkei 225 make a new high?
The Nikkei 225 has had a decidedly positive reaction to the election result over the weekend. Japanese Prime Minister Fumio Kishida has secured an outright majority in the lower house for his incumbent Liberal Democratic Party (LDP).
It is being reported that the election result gave the LDP 261 seats of the 465 seats available. This is less than the 276 seats it held prior to the election but it is still a clear majority and has avoided the worst-case scenario.
Some polls were showing that the LDP might lose their parliamentary majority and that would have made implementation of a stimulus package more difficult to execute.
The Japanese economy has been struggling to gain traction throughout the pandemic and the recent run up in energy prices presents another hurdle for the LDP. Japan is a significant importer of energy.
The latest producer price indices show the costs for Japanese businesses accelerating to 6.3% for the year to the end of September. Supply bottlenecks continue to plague international trade.
Many of Kishidas policies announced during the campaign remain vague but he has pledges to spend tens of trillions of yen. The Yen itself has been depreciating since Kishida became the LDP leader in last September in anticipation of loose fiscal policy.
Japanese equities are seeing the government spending as a boost to the economy and helping companies get back on track.
NIKKEI 225 TECHNICAL ANALYSIS
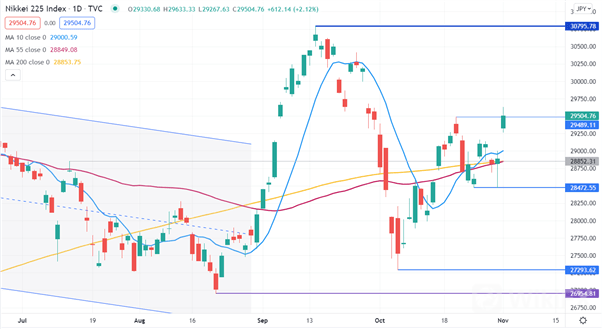
The Nikkei 225 index went to its highest level in over 30 years in mid-September. The high at 30795.78 might now offer resistance.
Todays price action has the price move above a recent previous high at 29489.11 and a close above here may provide a pivot point support. Below the market, a previous low at 28472.55 might provide support.
Below the price, there is a cluster of short, medium and long term simple moving averages (SMA) near an historical pivot point of 28852.81. The 10-day SMA has moved above the 55-day and 200-day SMAs. If the 55-day SMA moves above the 200-day SMA, there is a potential for a bullish triple moving average (TMA) formation.
A bullish TMA requires the price to be above the short term SMA, which needs to be above the medium term SMA, which needs to be above the long term SMA. All SMAs must also have a positive gradient. The reverse of all of these conditions would be required for a bearish TMA.

Leave a Reply