-
New Zealand Dollar falls versus USD as Wall Street breaks win streak
-
Chinese inflation data (Oct) in focus for todays APAC session
-
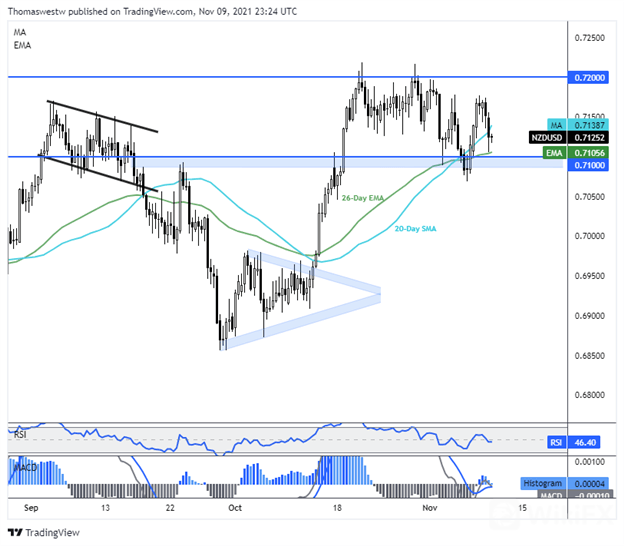
NZD/USD trades between key moving averages

WEDNESDAY‘S ASIA-PACIFIC FORECAST
The New Zealand Dollar fell versus the US Dollar overnight as Wall Street stocks broke a multi-day winning streak. NZD/USD’s loss came despite upbeat economic data from the island nation. The benchmark S&P 500 index lost 0.35% at the closing bell. Still, US equity indexes remain near all-time highs following a mostly positive slate of corporate earnings. Shares of DoorDash gained nearly 25% in after-hours trading after the food delivery service reported rosy earnings along with a corporate acquisition.
Treasuries caught a bid, sending yields lower across the curve. The benchmark 10-year note‘s yield fell to the lowest point since September 24 at 1.415%. A core reading in October’s producer price index (PPI) missed expectations at 0.4% m/m versus the expected 0.5% increase. Investors continue to monitor the global inflation threat. Today will see Chinese inflation data cross the wires.
Speaking of inflation, crude oil prices are moving higher after the American Petroleum Institute (API) reported a surprise draw in US oil stockpiles. Crude oil stocks fell 2.49 million barrels for the week ending November 5, according to the API data. Energy traders will watch tomorrows EIA report for confirmation, but for now, bulls are in firm control with the data.
This morning saw Australia‘s Westpac report consumer confidence data. The index for November increased/decreased to 105.3 from 104.6 in October. This follows a rollback of Covid restrictions across Australia as vaccine rates hit sufficient levels to warrant easing measures. The upbeat figure bodes well for the country going into this week’s jobs report due out Thursday.
NZD/USD TECHNICAL FORECAST
NZD/USD fell below its rising 20-day Simple Moving Average (SMA) overnight before pressure eased early in the APAC session. The 26-day Exponential Moving Average (EMA), along with confluent 0.71 psychological resistance, turned away a deeper downside move. Prices may grate between these two moving average in todays session if volatility reemerges.
NZD/USD 8-HOUR CHART
Source: DailyFX

Leave a Reply