-
Crude oil prices maintain lofty levels as new supply is unlikely
-
APAC equities were mixed as China tries to isolate Evergrande
-
Nikkei 225 falls as Yen rallies. Where to USD/JPY from here?

Yields continued higher overnight with US Treasury 10-years at 1.67% and APAC bonds followed suit with New Zealand government 10-years at 2.48%, up over 5 basis points today.
In currency land, the Japanese Yen is the strongest across the board, reversing recent trends. Rising yields and a stronger Yen undermined the Nikkei 225.
Asian equities were mixed after a patchy US session. The Evergrande saga continues with Hopson pulling out of buying a controlling interest in the profitable business of property management services.
It appears there is an effort to ringfence Evergrande from other property groups. There have been a number of Chinese officials commenting in the last 24 hours that the risks in the property market are controllable and that funding conditions for the sector are returning to normal.
China have worked on trying to tame runaway energy prices. It may have had some effect as Chinese coal futures were 11% off their highs at one stage today.
A Saudi Arabian government official has said that OPEC+ are powerless to impact energy prices. Both Brent and WTI crude oil are holding near 7-year highs. The Canadian Dollar paused today against the US Dollar after rallying for most of the month.
Bitcoin made a record high, trading above US$ 66,000 for the first time. The ETF launched yesterday grabbed a lot of attention and seems to have created a lot of enthusiasm for the cryptocurrency.
USD/JPY TECHNICAL ANALYSIS
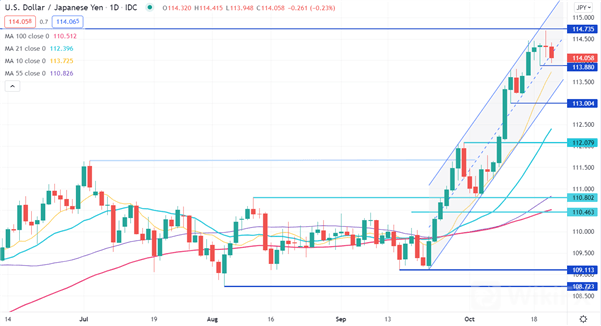
USD/JPY made a new high for the year in late September and has been in a steep ascending trend channel since. The previous high in 2017 at 114.735 may offer resistance.
The consistent upward trajectory has seen short, medium and long-term simple moving averages (SMA) all develop a positive gradient. All the SMAs are in order according to their tenure with the shorter term SMA above the medium term SMAs and the medium term SMAs above the long term SMAs. The price is above all SMAs.
If this arrangement holds, bullish momentum might continue to evolve A move below these SMAs could signal a pause in bullishness.
Potential support may lie at the previous lows of 113.88 and 113.004. Below that, pivot points at 112.079 and 110.802 are possible support levels.

Source: DailyFX
Leave a Reply