-
Cryptos hold bullish momentum despite dampening sentiment in markets
-
BTC/USD faces key test between $50,000 and $55,000

After a consistently strong performance for the last week, Bitcoin has managed to place itself above the $50,000 mark for the first time in a month. I have to say, looking at the daily chart, the rise looks healthier this time as momentum has built steadily from the $40,000 area without facing rejection before crossing $50,000, as it has done many times before.
Cryptocurrencies have been getting a boost from key US institutions confirming they will not ban the use of cryptos after China has continuously clamped down on the digital currency space. First was the Federal Reserve last week, with Chairman Jerome Powell saying he has no intention of banning the use of cryptos despite pushing for the development of a digital dollar. And the Securities and Exchange Commission (SEC) followed suit yesterday as its Chair Gary Gensler told Congress that he has no intention of banning crypto either, pointing out that it would be up to Congress to decide.
This acceptance of cryptos makes them more mainstream which has led to a more correlated relationship with traditional assets, evidenced over the last few weeks as Bitcoin was following stocks lower on the back of concerns about the economy and the collapse of Evergrande. But we may be at the start of a de-correlation as Bitcoin and most alt-coins have held gains over the last week despite weaker sentiment in the overall market. It might be soon to tell, but with the global economies facing mounting debt and growth concerns we may start to see the outperformance in cryptocurrencies we have lacked the rest of the year.
Looking at the BTC/USD chart, the short-term trend is positive with higher lows reinforcing the push higher. That said, as I have mentioned before, the gap between $50,000 and $55,000 is a challenging one, an area that halted and reversed the bullish momentum at the beginning of September, so the next few sessions are going to be crucial to the continuation of the bullish trend. Weve already seen some hesitation as resistance arises at $51,890 so its now the case of making sure that this is just a pullback for new buyers to come in and gather momentum rather than the start of a correction back below $50,000.
BTC/USD Daily Chart

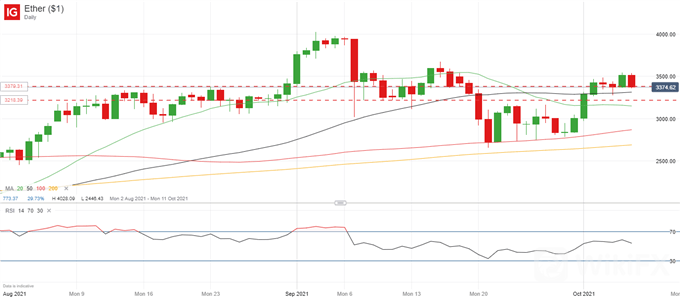
Meanwhile, Ether is amongst the worst performers today, dropping over 4% at the start of the European session. ETH/USD is now resting on a key horizontal line at $3,379, which is the upper bound of a confluence area that has been attracting buyers and sellers over the past few months. The long-term outlook is strongly bullish for Ether as technological advances and its intrinsic potential hike its valuation, but ETH/USD is likely to face increased resistance toward the $4,000 mark over the coming quarter. As of now, $3,218 is likely to offer some support, followed by the $3,000 mark, whilst $3,570 is the area to look out for a bullish break.
ETH/USD Daily chart

Source: DailyFX
Leave a Reply