Gold and the US Dollar have been rising in tandem for a short while after a much higher than expected US CPI print last week put a rocket under Treasury yields. This inflationary scare helped the precious metal re-align as a potential hedge against rising prices. This alliance with the ‘big dollar’ changed overnight. As USD moved to make another fresh high for the year, gold got dusted and went lower.
US Treasury yields at the back-end moved up with 10 and 30-year rates rising, while the front of the curve saw 2 and 5 years unable to make a new high. This could suggest that the rise in yields in this episode is less focused on short-term inflation, but term risk, as the economy recovers further down the track from the pandemic.
This rise in longer term yields was after comments from after Federal Reserve Bank of St. Louis President, James Bullard, said that Fed speed up the taper process in response to inflation.
Strong retail sales numbers in the US also boosted yields and the outlook in general for the US economy, to the benefit of USD.
Other base metals also moved lower in these last few sessions, particularly aluminium and copper. This hints toward the weakness in XAU being US Dollar strength related, rather an issue with the gold itself.
With this in mind, US Dollar direction could be the key for the next move in gold. There is quite a lot of US data due out for the rest of the week. However, comments from Fed officials might play a bigger role due to implications for US yields, especially if something unexpected is said
GOLD TECHNICAL ANALYSIS
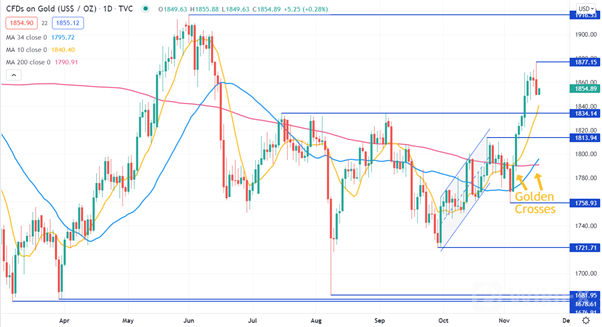
The broad range of 1676.91 – 1916.53, in play since earlier in the year, might provide support and resistance respectively.
The recent break above 1834.14 might open up a new, narrower trading range for gold. 1834.14, now a pivot point, might be support and 1916.53 the potential resistance.
November 4th saw a Golden Cross occur when the short-term 10-day simple moving average (SMA)crossed above the long-term 200-day SMA. A second Golden Cross unfolded yesterday when the medium-term 34-day SMA also crossed above the 200-day SMA. This may signal bullishness momentum.
Near term resistance could be at the recent high of 1877.15. On the downside, there are pivot points at 1834.14 and 1813.94 then prior lows at 1758.93 and 1721.71 that are possible support levels.


Leave a Reply