Gold prices moved slightly lower overnight after mixed US economic data. The Federal Reserve reported a sharp drop in US industrial production for September. The month-over-month figure crossed the wires at -1.3% versus the +0.2% consensus forecast, according to the DailyFX Economic Calendar. The October NAHB Housing Market Index rose to 80 versus a forecasted 76, which was also the previous months figure.
Treasury yields moved slightly higher to start the week, which helped explain gold‘s lackluster performance. The US data follows Monday’s downbeat Chinese GDP growth figures, which disappointed investors. Meanwhile, inflation in New Zealand rose much faster than expected, with third-quarter CPI reported at 4.9% versus 4.1% expected. The report sent traders rushing out of government Kiwi bonds, sending yields surging.
The rise in government bond yields reflects growing central bank rate hike bets despite growth hiccups. Traders appear to be growing hawkish on global central bank policies. That bodes poorly for gold, which is a non-interest-bearing asset. The chance for a 25 basis point Federal Reserve rate hike for the July 2022 meeting increased to 40.3% from 35.0% a week ago, according to the CME Group FedWatch Tool. Rate traders sell bonds when they believe rates will rise.
The United Kingdom and the Euro Area will provide markets with more inflation data later this week, but for now, it appears markets are starting to price in longer-run inflation. That goes against the Fed‘s transitory outlook on prices. Inflation metrics across the major global economies will likely begin to influence rate bets at a higher degree in the coming months. Overall, however, the inflation outlook is negative for gold due to the market’s position going into a higher rate environment.
GOLD TECHNICAL FORECAST:
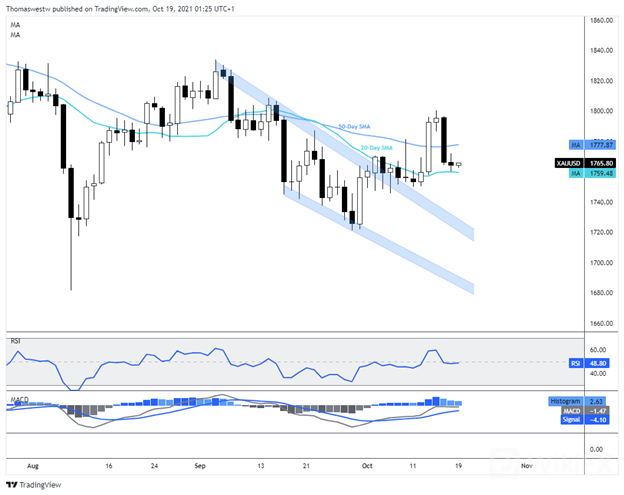
Gold prices are trading between the 20- and 50-day Simple Moving Averages (SMAs) after price surrendered some upside late last week. XAU/USD is trading nearly half a percent higher on the month after dropping in August and September.
A break below the 20-day SMA could see former wedge resistance turned support come back into play to underpin prices. Alternatively, bulls will look to break above the 50-day SMA before challenging the October swing high at 1800.50, which is the highest level since mid-September.
GOLD DAILY CHART

Leave a Reply