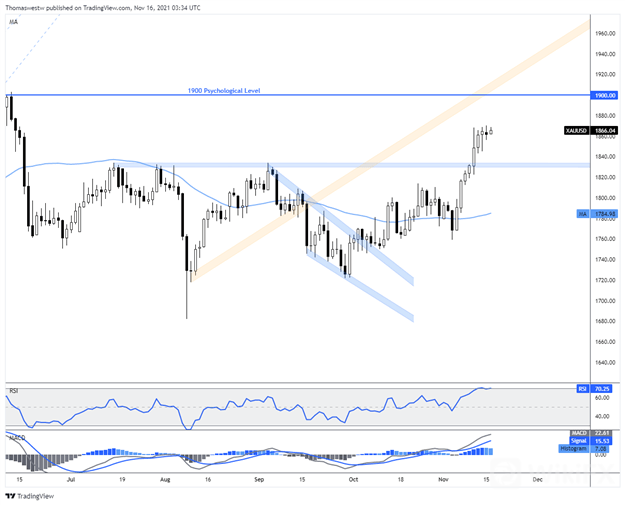
Gold‘s recent upside appears to be stalling out after prices cleared a key level of resistance during last week’s big +2.64% gain. XAU is currently trading near the highest levels since early June despite rising Treasury yields and a stronger US Dollar – two things which typically work against the non-interest-bearing asset.
Still, given gold‘s recent move amid inflation hitting multi-decade highs via the CPI index, it's clear investors’ appetite for the yellow metal is heating up. Historically, gold is viewed as a store of value and an asset that withstands periods of economic stagnation. Gold also has an inflation-hedging appeal – although there is a debate over that claims veracity.
However, higher inflation has bolstered Federal Reserve rate hike bets. That has thrown doubt on the equity markets ability to keep pacing higher should monetary policy tighten too quickly. Gold traditionally performs well during times of higher volatility, as investors favor the asset to smooth out volatility within their portfolios. Following this line of logic lays out a rather bullish path for gold.
That said, upcoming economic data out of the United States in the form of retail sales may provide the next directional driver for gold prices. The preliminary print for October retail sales is expected to cross the wires at 1.5%, according to a Bloomberg survey. That would be up from 0.6% in September. A stronger-than-expected figure would likely further shift Fed rate hike bets to the left.
Federal Funds futures are pricing in a nearly 50% chance for a 25 basis point Fed rate hike at the June 2022 FOMC meeting, up from 45.5% just a week ago per the CME‘s FedWatch Tool. Gold’s ability to weather higher rate hike bets, along with a stronger Greenback and higher rates, is an encouraging sign. It could even signal a shifting market dynamic on a broader scale – perhaps one that could bode well for the yellow metal.
GOLD TECHNICAL FORECAST
XAU/USD sliced above a critical level of resistance that has capped golds upside going back to July. The break higher brought further strength, with the 1900 psychological level now in focus. A pullback would see the rising 9-day Exponential Moving Average (EMA) offer possible support, with the aforementioned resistance level below that.
GOLD PRICE CHART


Leave a Reply