Gold (USD/XAU) Analysis
-
Rampant USD and weak Chinese Industrial data weigh on the precious metal
-
The falling stock market may be adding to golds recent bearish momentum
-
(XAU/USD) Key technical levels analyzed
Gold Declines as the US dollar Climbs Higher
Gold continued last week‘s downtrend and trades lower in the London AM session on Monday. From a fundamental perspective, gold’s outlook is bearish as global interest rates are on the rise in response to surging inflation, worsening the appeal of holding the non-interest-yielding commodity.
The US dollar index (DXY) is a weighted currency index which is generally used as a benchmark for US dollar performance. DXY continues its upward trend after last weeks US inflation data for April – which printed lower than the March print – surprised to the upside. Higher inflation data underpins the value of the greenback at a time when the Fed is fully motivated to raise the Fed funds rate. Current market expectations see the Fed hiking rates a further 190 basis points before the end of the year
The dollar effect on gold appears to be outweighing the effect of inflation on gold prices. Gold has been lauded as an inflation hedge, however, the relationship holds up better over the long-term, meaning that higher inflation in the short term is actually more likely to result in lower gold prices due to the stronger dollar and higher interest rates adjustment that typically follows.
Weak Chinese Industrial Data Trumps Easing Lockdown Measures.
China announced it ‘will work to restore normality’ in Shanghai from June the 1st and the news should have buoyed global sentiment, however, disappointing industrial production data for April soured the mood. Industrial production declined by -2.9% compared to April last year, drastically missing the forecast figure of a 0.4% increase.
Stock Market Losses Contributing to Lower Gold Prices?
When equity markets fall, money managers may decide to cash in other fairly liquid instruments, like gold, to fund losses in the stock market. Therefore, continued declines in equity markets could support gold‘s bearish trend. With the Fed all but certain to hike rates by another 50 basis points in the June meeting, the narrative around equities continues to support ’selling rallies‘ as opposed to the ’buy the dip narrative that extended throughout the global recovery and extremely loose monetary policy. Therefore, gold looks susceptible to further declines.
Gold Key Technical Levels
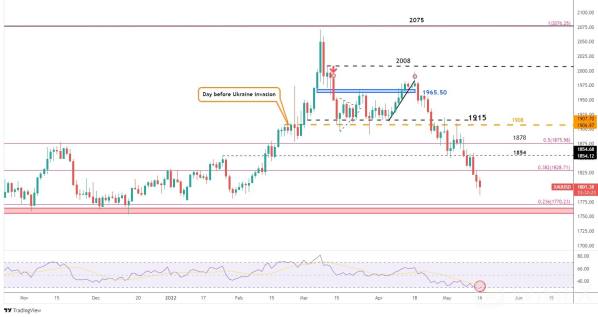
The bearish trend continues from last week but the RSI has just dipped into oversold territory, while the daily candle has also pulled back a fair amount since the start of trading. A pullback towards 1828/1830 (38.2% Fib level of the 2020 to March 2021 move) could be on the cards if the precious metal fails to make it 3 successive down days.
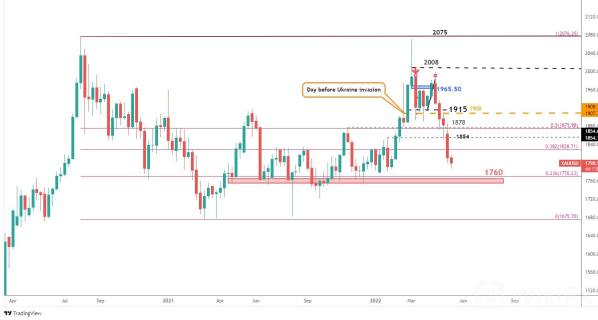
The zone of support with a mid-point of 1760 appears as the next significant level of support with a breach of that zone opening the door to 1723 level.
Daily Gold Chart

The weekly gold chart helps to view the current move in the context of the longer-term levels/zones. The 1760 zone has been instrumental in creating a price floor for gold as previous breaches proved to be extremely short-lived. It remains to be seen if this zone will hold once again and if it fails, 1723 and 1677 appear as longer term price levels of interest.
Weekly Gold Chart
dodow
hgcgcggc

You can down wikifx in playstore or app store to get more information

Leave a Reply