Bearish View
Sell the GBP/USD and set a take-profit at 1.3550.
Add a stop-loss at 1.2600.
Timeline: 1-2 days.
Bullish View
Set a buy-stop at 1.2525 and a take-profit at 1.2625.
Add a stop-loss at 1.2450.
The GBP/USD pair pulled back signaling that the recent recovery trade has ended. The pair declined to a low of 1.2454 as the Fed started implementing its quantitative tightening program and as investors positioned themselves for the upcoming jobs data.
US Dollar Strength
The GBP/USD pair declined as the US dollar index continued making a comeback. The closely-watched dollar index rose by more than 0.80% while the CBOE volatility index rose by 5%.
At the same time, American equities turned lower, with the Dow Jones and Nasdaq 100 shedding more than 1%. This was a sharp reversal since they were all in the green when the market opened.
The main catalyst for the performance was that the Fed has started reducing its balance sheet gradually. It will scale down its assets by about $47.5 billion per month and then double the amount later this year.
Investors are looking ahead to the upcoming US jobs numbers that are scheduled for the coming two days. On Thursday, ADP will release its estimate of the jobs created by the private sector. Analysts expect these numbers to show that the economy added over 300k jobs in May.
As you recall, some of the biggest employers like Walmart and Target warned that they would start scaling back their employees. They noted that they had overhired during the pandemic boom.
The official jobs numbers will come out on Friday. Analysts expect these numbers to show that the economy added over 320k jobs in May while the unemployment rate declined to 3.5%. With inflation surging, the most important data to watch will be on wages, which are expected to have grown by 5.2%.
The GBP/USD pair also declined after signs emerged that the UK housing market was slowing down as the cost of borrowing rose.
GBP/USD Forecast
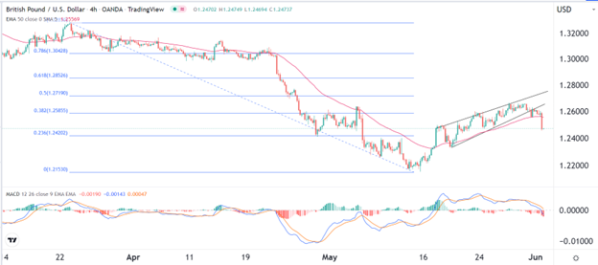
The four-hour chart shows that the GBP/USD pair formed a rising wedge pattern recently. Historically, this pattern is usually a bearish sign. The pair managed to move below the lower side of the wedge pattern this week.
Also, it fell below the 25-day and 50-day moving averages and is now approaching the 23.6% Fibonacci retracement level. The MACD has moved below the neutral point. Therefore, the outlook for the pair is bearish, with the next key support being at 1.2350.
Leave a Reply