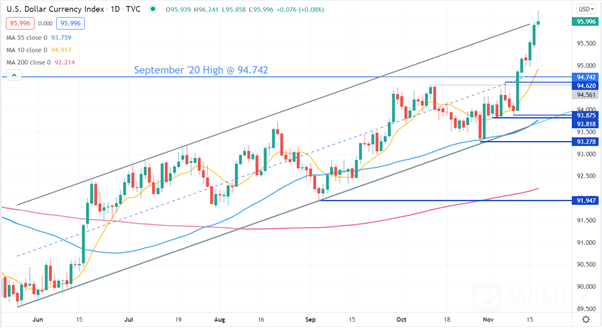
The US Dollar made a new high for the year on the back of solid data and more hawkish Fed commentary.
US retail sales advanced 1.7% for the month of October, beating 1.4% expected. US industrial production also surprised to the upside, coming in at 1.6% for October instead of 0.9%forecast.
On Bloomberg television, Federal Reserve Bank of St. Louis President James Bullard led US yields higher with some very hawkish commentary. He acknowledged that both headline and core inflation were high and well above targets.
He believes that the Fed should speed up the reduction in asset purchases to USD 20 billion a month. This would cease the asset purchase program by the end of the first quarter next year.
Mr Bullard wasnt concerned about a taper tantrum because the market has been comfortable with stimulus withdrawal plans so far. He could also see rates rising before the end of the asset purchase program if conditions warranted it. Bullard currently has two rate hikes pencilled for the end of 2022.
Consequently, US 10-yearTreasury yields nudged 1.65% and 30-years hit a high of 2.04%. This pushed the US Dollar up, as measured by the DXY index, to a new peak for the year. The Dollars strength saw oil, gold, copper and aluminium in particular move lower.
The Australian Dollar came under pressure after wages data met consensus forecasts but disappointed a bond market looking for a beat. The wage price index rose by 0.6% for the third quarter and 2.2% for the year, in line with expectations.
Aussie 10-year yields were unchanged but 2- and 3-year bonds dropped around 3 basis points each. Iron ore also continued lower, undermining AUD. CBA, Australias largest bank, dragged the ASX 200 down after reporting lower net interest margins. The stock closed 8% lower.
Japan saw core machine orders come in flat (0.0%) for the month of September, missing 1.5% anticipated, and an annual rate of 12.5%, well below 17.6% expected. This represents significant downward revisions.
The Yen remains under pressure, especially against USD. Japanese equities were lower and other APAC equities were generally weaker as well.
Looking ahead, the US will see MBA mortgage applications and housing starts numbers released. Canada will have CPI data out in the meanwhile.
DXY INDEX (US DOLLAR) TECHNICAL ANALYSIS
The DXY index surged through the September high of 94.742 and has threatened to break above a rising channel. For now, it has pulled back inside that channel.
A bullish triple moving average (TMA) formation requires the price to be above the short term simple moving average (SMA), the latter to be above the medium term SMA and the medium term SMA to be above the long term SMA. All SMAs also need to have a positive gradient.
Looking at the 10, 55 and 200-day SMAs, the TMA conditions were met on the break of 94.742 last week. If the price moves below the 10-day SMA, the TMA will turn to neutral.
Support could be at the pivot points of 94.742 or 94.620. Further down, the previous lows of 93.875, 93.818 and 93.278 may provide support.


Leave a Reply