CANADIAN DOLLAR OUTLOOK:

FUNDAMENTAL FACTORS SHIFT
The Canadian Dollar has had a rough run through the first week-plus of November as a slew of factors have turned against the Loonie in the short-term. A resurgent US Dollar coupled with weakness in equity markets has triggered a risk-off move, lifting USD/CAD and harming CAD/JPY.
But domestic factors are in play as well: Canadian economic data has been disappointing of late, with the Canada Citi Economic Surprise Index dropping from +58.6 on October 25 to +22.3 today; and oil prices have experienced volatility in weakness in recent sessions (energy constitutes approximately 11% of the Canadian economy).
These combined forces see the Canadian Dollars technical footing slipping in pairs like USD/CAD and CAD/JPY, suggesting that more weakness may resolve itself in the short-term.
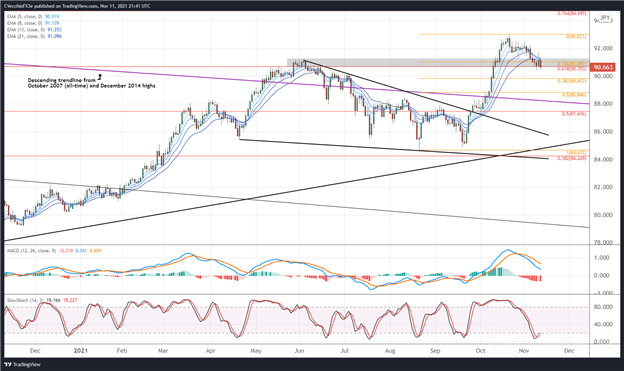
CAD/JPY RATE TECHNICAL ANALYSIS: DAILY CHART (NOVEMBER 2020 TO NOVEMBER 2021) (CHART 1)

CAD/JPY rates may soon experience a deeper pullback, continuing the trend in place since late-October. Having failed to treat the former yearly high zone set in late-May and early-June around 90.75/91.19 as support, the pair now finds itself sliding below the 61.8% Fibonacci retracement of the June 2015 high/March 2020 low range at 90.70.
Bearish momentum is accelerating, with CAD/JPY rates below their daily 5-, 8-, 13-, and 21-EMA envelope, which has aligned in bearish sequential order. Daily MACD continues to decline (albeit above its signal line), while daily Slow Stochastics are holding in overbought territory. A deeper setback towards the 38.2% and 50% Fibonacci retracements of the August 2021 low/October 2021 high range at 89.83 and 88.85, respectively, cant be ruled out in the near-term.
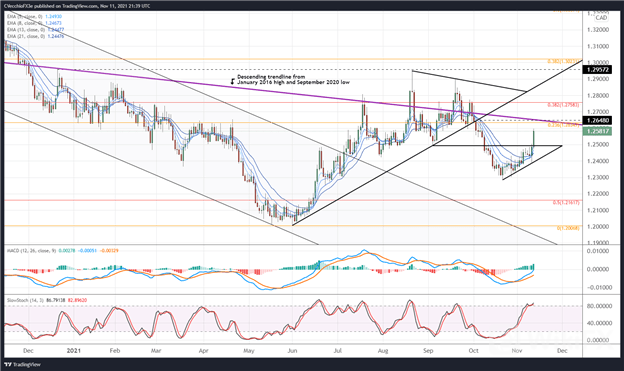
USD/CAD RATE TECHNICAL ANALYSIS: DAILY CHART (NOVEMBER 2020 TO NOVEMBER 2021) (CHART 2)

USD/CAD rates broke above ascending triangle resistance today, with resistance coming in the form of the September swing low as well as the October 12 high around 1.2595. More gains may be ahead in the coming day as the pair progresses towards the 23.6% Fibonacci retracement of the March 2020 high/June 2021 low range at 1.2635, which also coincides with the descending trendline from the January 2016 and September 2020 (a trendline that has served as resistance and support on numerous occasions over the past few years). Bullish momentum is increasing, with the pair fully above its daily EMA envelope. Daily MACD is starting to cross above its signal line, while daily Slow Stochastics are holding in overbought territory.
USD/CAD: Retail trader data shows 61.72% of traders are net-long with the ratio of traders long to short at 1.61 to 1. The number of traders net-long is 19.47% lower than yesterday and 20.48% lower from last week, while the number of traders net-short is 12.08% higher than yesterday and 19.78% higher from last week.
We typically take a contrarian view to crowd sentiment, and the fact traders are net-long suggests USD/CAD prices may continue to fall.
Yet traders are less net-long than yesterday and compared with last week. Recent changes in sentiment warn that the current USD/CAD price trend may soon reverse higher despite the fact traders remain net-long.
Source: DailyFX

Leave a Reply