GBP/USD – PRICES, CHARTS, AND ANALYSIS
· Sterling strength and US dollar help GBP/USD move higher.
· Little in the way of market-moving data in the UK next week.
· Cable has put in a good shift over the past few days and is looking set to end the week in positive territory. This week‘s UK data releases beat market expectations but still show the enormous problem that the Bank of England faces in the coming months. Headline inflation is running hot at 9% and according to the BoE may even hit double-digits in the coming months before falling in late 2022/early 2023. The Labor market remains tight, adding extra pressure on wages as companies look to keep existing employees and entice new staff to their payroll. All told, the BoE will need to keep hiking interest rates as their primary tool against price pressures while making sure they don’t choke off growth.
· Next weeks econ

Next weeks economic calendar is fairly light with only the latest manufacturing and services PMIs to look out for. For all market-moving economic data and events, refer to the

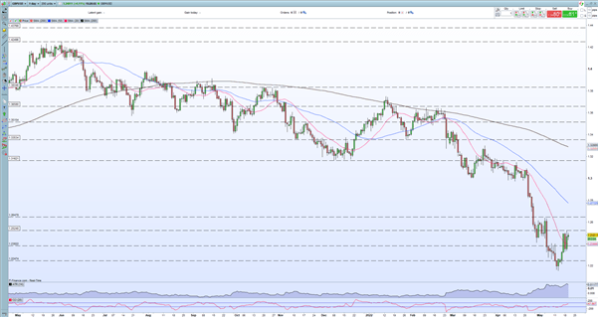
While UK economic data has helped to push cable higher, a bout of US dollar weakness has also allowed the pair to gain over two big figures on the week. The recent sharp moves in the pair have pushed the 14-day ATR – a volatility measure – to multi-month highs and this reading, currently, 117 pips, should be factored in when taking any position in the pair. A convincing break above Thursdays 1.2525 high would open the way to a zone between 1.2600 and 1.2650. Above here there is little in the way of technical resistance before a cluster of 1.3000 trades comes into play.
While the chart may look positive, a move back to the 1.3000 level may take a while, if at all, as the US dollar will continue to play a major role in GBP/USDs future. Traders should also be aware of events in the US next week which include FOMC minutes on Wednesday, the first look at US Q2 GDP on Thursday, and updated inflation data on Friday.
GBP/USD DAILY PRICE CHART, MAY 20, 2022
Retail trader data show 72.05% of traders are net-long with the ratio of traders long to short at 2.58 to 1. The number of traders net-long is 2.82% lower than yesterday and 18.51% lower from last week, while the number of traders net-short is 4.17% higher than yesterday and 44.23% higher from last week.
We typically take a contrarian view to crowd sentiment, and the fact traders are net-long suggests GBP/USD prices may continue to fall. Yet traders are less net-long than yesterday and compared with last week. Recent changes in sentiment warn that the current GBP/USD price trend may soon reverse higher despite the fact traders remain net-long.
If you want to know more information about the reliability of certain
brokers, you can open our website (https://www.WikiFX.com/en). Or you
can download the WikiFX APP for free through this link
(https://www.wikifx.com/en/download.html). Running well in both the
Android system and the IOS system, the WikiFX APP offers you the easiest
and most convenient way to seek the brokers you are curious about.

Leave a Reply