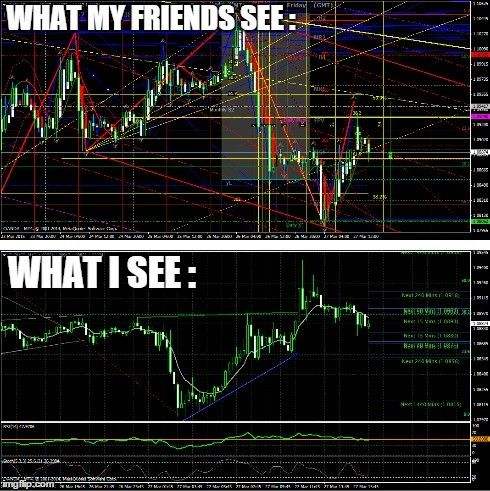
Trend-following indicators are technical tools that measure the direction and strength of trends in the chosen time frame. Some trend-following indicators are placed directly on the price panel, issuing a bearish signal when positioned above price and a bullish signal when situated below price. Others are drawn below the panel, generating upticks and downticks from 0 to 100 or across a central ‘zero’ line, generating bullish or bearish divergences when opposing price.
Most trend-following indicators are ‘lagging’, meaning they generate a buy or sell signal after a trend or reversal is underway. The moving average is the most popular lagging trend-following indicator. These indicators can also be ‘leading’, meaning they predict price action before it starts by using multiple calculations and comparing momentum in different time frames. Parabolic Stop and Reverse (Parabolic SAR) is a popular leading trend-following indicator.
These indicators have three primary functions. First, they attempt to alert the technician to a developing trend or an impending reversal. Second, they attempt to predict short- and long-term price direction. Third, they confirm observations and signals in the price pattern and other technical indicators. Signal reliability is limited to the settings used to draw the trend-following indicator. For example, a 50-day moving average and a 200-day moving average generate unique buy and sell signals that may work in one time frame but not the other.
Simple Moving Average (SMA)
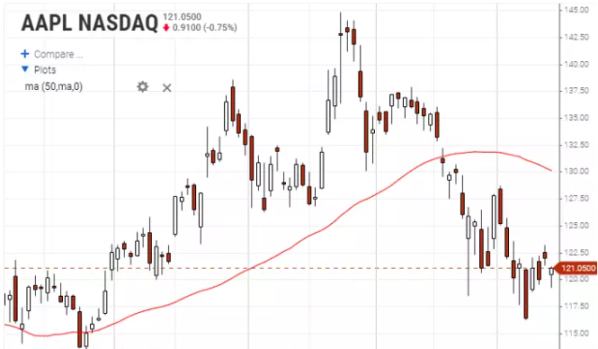
The Simple Moving Average (SMA) measures the average price across a range of price bars chosen in the settings by the technician. Closing prices are commonly used in the calculation but the open, high, low, or median price is often applied as a substitute. The indicator is a highly-effective technical tool used to evaluate the strength of the current trend and to determine if an established trend will continue or reverse. The SMA is less effective for prediction in sideways and rangebound markets.
The calculation simply sums up prices over the chosen period and divides by that period. Each data point adds to a line placed in the same panel as price. Interactions between price and the moving average generate bullish and bearish divergences that evaluate trend strength and direction. For example, price falling below a 20-day SMA in an established uptrend denotes unusual weakness while price lifting above the 20-day SMA in a downtrend denotes unusual strength. The direction of the SMA also generates a divergence when opposing price action.
Exponential Moving Average (EMA)
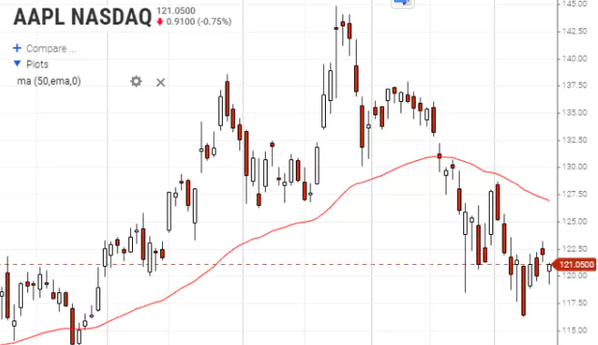
The Exponential Moving Average (EMA) measures the average price across a range of price bars chosen by the technician, placing greater weight on more recent data points. The EMA is a ‘weighted moving average’, meaning that price bars are not treated equally in the calculation. This moving average responds more quickly to recent price action than the simple moving average, theoretically generating earlier buy and sell signals.
The calculation assumes that recent price action will have a greater impact on trend direction than an equally weighted data series. However, this weighting also tends to generate more false signals than the SMA. Examining several EMAs at different time intervals can overcome the shortcomings of this moving average but the added complexity requires stronger interpretation skills. The 20-day, 50-day, and 200-day EMA combination has grown popular among traders in recent decades. The direction of the EMA and its relative positioning with price generate convergence-divergence relationships that are useful in trade management.
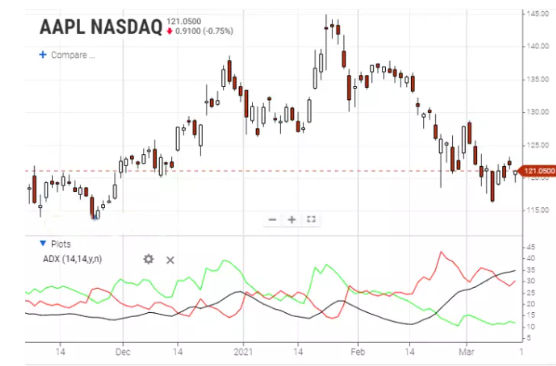
The Average Directional Index (ADX/DMS) measures the strength or weakness of an active trend. The quality of trend strength should correlate strongly with the persistence of the trend and capacity to generate profits for the trend-following trader or investor. ADX uses moving averages in several time frames to generate three lines that cross higher or lower through a panel with values between 0 and 100. These lines are designated ‘ADX’, ‘+DMI+’, and ‘-DMI’.
ADX measures the strength or weakness of an uptrend when +DMI is above -DMI, indicating that prices are rising. Conversely, ADX measures the strength or weakness of a downtrend when +DMI is below –DMI, indicating that prices are falling. ADX with values at or below 25 denotes a weak trend or rangebound market, lowering the reliability of this trend-following strategy. ADX direction also generates momentum signals, with a trend gathering strength when rising and losing strength when falling.
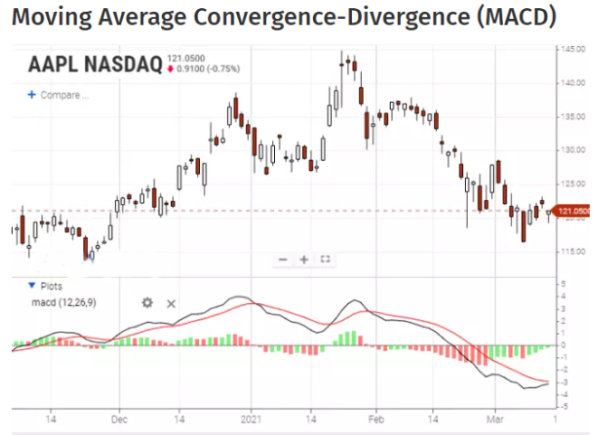
Moving Average Convergence-Divergence (MACD) is a highly popular technical tool developed by Gerald Appel in the 1960s. MACD analyzes the relationship between moving averages set at different intervals, generating a set of directional lines or a histogram that gauges current momentum and price direction. The indicator is commonly calculated by subtracting at 26-period EMA from a 12-period EMA. A 9-period EMA of the MACD, called the ‘signal line’, is then added to the plot.
MACD emits an assortment of visual data that generates crossovers, divergences, and sharp directional swings. The MACD histogram draws the distance between MACD and signal line and has become the most popular method to apply this indicator. A bullish divergence occurs when the histogram turns higher at an extreme below a zero line while price is falling and a bearish divergence when the histogram turns lower at an extreme above a zero line while price is rising. Crossovers above and below the zero line can also generate potent buy and sell signals.
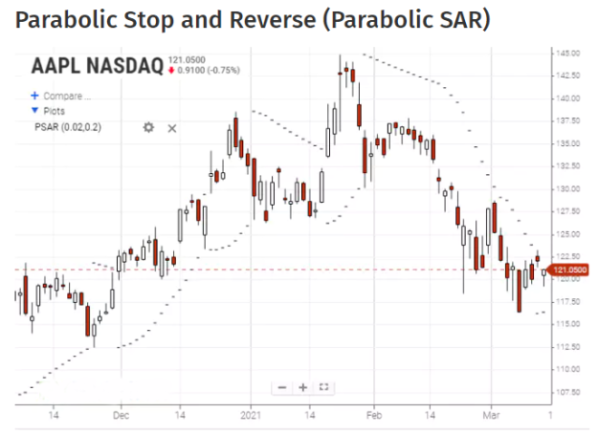
Developed by RSI creator Welles Wilder Jr, the Parabolic Stop and Reverse (Parabolic SAR) is used by technicians to confirm trend direction and to generate reversal signals. However, signals are only applicable within the time setting applied to the indicator. Indicator data points generate dots above or below price on the main chart panel. The calculation applies an ‘invisible’ trailing stop, forcing the indicator to change direction when hit, marking a potential reversal in trend. The indicator often generates reliable signals in strong trends and whipsaws in rangebound markets.
Parabolic SAR is most useful when analyzed in combination with the overall price pattern and other trend-following indicators. The trader or investor can also use the indicator as a tool to manage long and short positions, raising or lowering the stop loss after each data point to match the price of the last dot. Keep in mind this indicator issues continuous buy or sell signals, forcing the technician to look at other data to avoid over-trading.
Additional Trend-Following Indicators
Accumulative Swing Index – evaluates the long-term trend through changes in opening, closing, high, and low prices.
ADX/DMS – measures the strength or weakness of an active trend and how long it may persist before a reversal.
Alligator – uses three Fibonacci-tuned moving averages to identify trends and reversals.
Aroon – evaluates whether a security is trending or rangebound and, if trending, the strength or weakness of the advance or decline.
Aroon Oscillator – applies data from the Aroon indicator to determine if a trend is likely to persist. The oscillator generates a zero line that, when crossed, signals potential changes in trend.
Elder Ray Index – evaluates buying and selling pressure by separating price action into bull and bear power. The output is used to determine trend direction and high odds entry/exit prices.
Gator Oscillator – is used as an alternative to the Alligator indicator, drawing green and red histograms to determine if trends are getting stronger or weaker.
Linear Regression Forecast – uses regression analysis to compare price action to the expected mean, looking for high odds reversal signals.
Linear Regression Intercept – uses regression analysis to compare price action to the predicted value, looking for high odds reversal signals.
Linear Regression R2 – analyses the reliability of price vs regression prediction.
Linear Regression Slope – determines the average rate of change when using regression analysis and compares price action to the expected mean.
QStick – identifies trends by examining a moving average of the difference between the opening and closing price of a hourly, daily, weekly, or monthly price bar.
Rainbow Moving Average – plots multiple weighted moving averages to determine price extremes over the examined period.
Rainbow Oscillator – uses rainbow moving averages to evaluate trends by plotting bandwidth lines at the edges of a histogram.
Random Walk Index – compares an assets movement to random movement to determine if its noise or signal. The indicator issues buy and sell signals, depending on trend strength or weakness.
RAVI – also known as the Range Action Verification Index, the indicator evaluates current trend and projects future trend intensity through a histogram plotted with two moving averages.
Schaff Trend Cycle – identifies trends and issues buy and sell signals by examining acceleration and deceleration of price change over time.
Shinohara Intensity Ratio – evaluates trend intensity by plotting Strong Ratio (Strength) and Weak Ratio (Popularity) lines.
Supertrend – draws an overlay across price action that seeks to identify current trend direction.
Swing Index – predicts price action in short-term trading strategies through crossovers above and below a zero line.
Time Series Forecast – uses linear regression to identify divergences between current price and the expected mean. It is constructed to be more flexible than basic linear regression analysis.
Trend Intensity Index – tracks correlation between price movement and volume levels to evaluate the strength or weakness of a trend.
TRIX – displays percentage change of a triple smoothed exponential moving average in an effort to filter out inconsequential price movement.
Typical Price – draws a straight line plot of the average price for each bar to generate a more realistic view of developing trends than using closing prices.
Vertical Horizontal Filter – measures the intensity of trends by looking at the highest and lowest prices over the specified time period.
Weighted Close – calculates the average price between the high, low, and close of each bar, placing greater weight on the close.
ZigZag – connects plot points on a price chart that reverse whenever the asset reverses by more than a specified percentage.

Leave a Reply