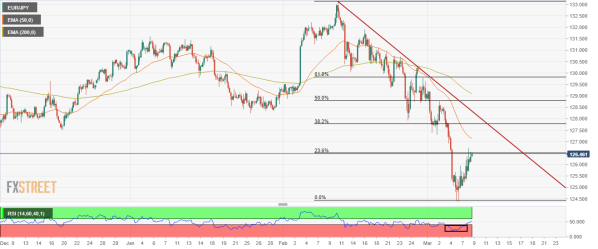
EUR/JPY is struggling to violate 23.6% Fibo retracement at 126.50.
The RSI (14) is likely to find resistance near 60.00 amid the broader bearish picture.
The shared currency awaits a violation of 126.73 for upside momentum.
On a four-hour scale, EUR/JPY is struggling to overstep a 23.6% Fibonacci retracement, which is placed from February 10 high at 133.15 to March 7 low at 124.39. Usually, a struggle near 23.6% Fibo retracement denotes a fresh corrective wave after an impulsive one.
The 50-period and 200-period Exponential Moving Averages are trading at 127.15 and 129.10 respectively, which have recorded a bearish crossover, which adds to the upside filters.
Meanwhile, the Relative Strength Index (RSI) (14) has surpassed 40.00 after oscillating in a bearish range of 20.00-40.00. The ongoing oscillator action is indicating that the RSI (14) may find resistance near 60.00 and will trade lower or consolidate.
As the asset is hovering around the 23.6% Fibo retracement, it is likely to address significant offers if the asset tumble below Wednesday‘s low at 126.12. This will grind the cross lower towards Tuesday’s low at 125.22 and Mondays low at 124.39.
On the flip side, a bullish momentum can be observed if the pair climbs above Tuesdays high at 126.73. A breach of 126.73 will send the cross towards the 50-EMA and 38.2% Fibo retracement at 127.15 and 127.80, respectively.
EUR/JPY four-hour chart

Leave a Reply