-
Gold has been moving up as the US Dollar drifts lower before CPI
-
Treasury yields and real rates diminish, debt fades as an alternate asset
-
Inflation correlation not there, but the Fed might be. Will gold glisten?

Gold has been moving higher in the last few sessions as the US Dollar weakens and yields take a dive with 10-year Treasuries recently trading as low as 1.415%.
The precious metal has historically been susceptible to yields, particularly real yields. Real yields have been going lower across the curve so far this week. Some market participants view gold as a hedge against inflation.
Ahead of US CPI today, US PPI came in on expectations at 0.6% for the month of October to give a year-on-year print of 8.6%. Expectations for headline US CPI are 0.6% and 5.9% respectively.
With PPI outstripping CPI, it hard to see CPI backing off in any hurry. Businesses can either reduce their profit margins, pass on the costs to consumers or do a combination of these.
Given the market forces that put pressure on companies that do not deliver on earnings estimates, it may seem that passing on costs might be the easiest option for management.
A potentially robust outlook for inflation may not have the levity for the yellow metal that it might of previously. The past year has seen inflation run rampant, and yet gold is little changed.
The inflationary impact for gold might be felt through the impacts on USD and yields. Which, in turn, will be the result of how the Federal Reserve goes about tightening monetary policy. For now, the Fed isnt worried about inflation, but at some point, they might be.
GOLD TECHNICAL ANALYSIS
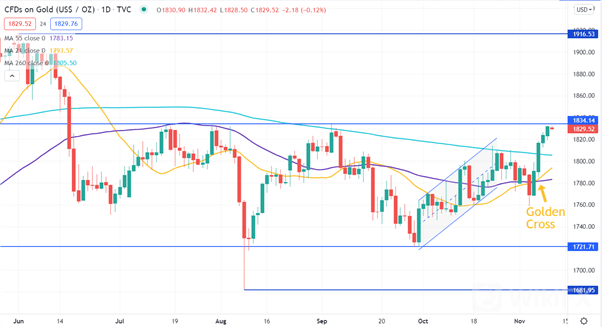
The wide range of 1721.71 – 1834.14 might provide support and resistance respectively. The recent rally is testing the top end of this range. A break above 1834.14 might open-up a new trading range for gold.
The rally has also seen a medium term Golden Cross form, where the 21-day simple moving average (SMA) crossed above the 55-day SMA. This may indicate medium term momentum is unfolding.
This recent move up has also seen the price cross over the 260-day SMA that has previously offered resistance or been an inflection point. It should be noted though that past performance is not indicative of future results.
Support could lie at a pivot point of 1813.94 or a previous low of 1758.93.


Leave a Reply